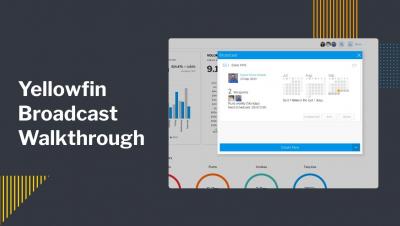
What is Yellowfin Broadcast? Adding Call-to-Actions to Your BI
One of the most common challenges of analytics adoption is ensuring that your customers or end-users can see and extract value from their data and reporting tools. Providing people with new and improved embedded analytics tools is unfortunately not enough to guarantee that everyone will be able to use them without additional assistance or encouragement.