
Get AI-generated reports that explain why your metrics changed, not only what happened, using connected live data, specific prompts, and a six-step process.
Most teams work across dozens of tools, and not all of them connect to their reporting workflows out of the box. There are always sources that fall outside the native integrations list: an internal tool your team built, a platform specific to your industry, or a piece of software that a vendor hasn’t prioritized supporting yet. When that data isn’t directly available, teams get it in however they can.
The ability to produce accurate and timely financial reports is a core skill needed in all organizations. Reports reveal the true health of companies, highlighting the positives and negatives that will affect enterprise performance for years to come. You have countless reports you can create, all with valuable insights to offer. But you should consider these a must.
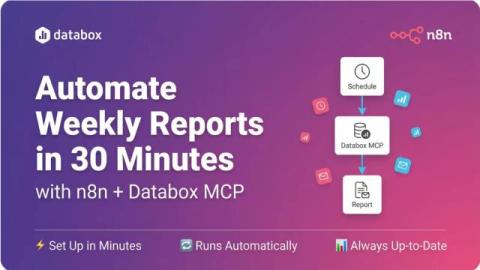
It’s Monday morning. Your team needs the weekly performance report. You open Google Ads and export the data. Then, GA4, export again. Then your CRM. Twenty minutes later, you’re still copying numbers into a spreadsheet, calculating week-over-week changes, and formatting everything for Slack and email. By the time you hit send, you’ve lost an hour you’ll never get back—and you’ll do it all again next week. There’s a better way.
Any time an organization closes the books or practices the governance needed to meet regulatory demand, it relies on reporting. Reporting technology is designed to save time while increasing accuracy, but many long-standing reporting vendors are existing or de-emphasizing this still-essential space. This leaves a gap for teams that need a modern, production-grade reporting solution. And when choosing between reporting tools, architecture is important.
A real estate Key Performance Indicator (KPI) or metric is a quantifiable measure used to assess the performance of a business in the real estate industry. These performance metrics can be used to analyze several different business segments from individual realtor performance to investment property potential. In turn, this information can be used to identify weaknesses in your business or help make better business decisions.
Are you tired of exporting data from your ERP, reformatting it in Excel, then discovering that you need to start over because someone entered a last-minute transaction? For finance teams everywhere, this frustrating cycle eats up hours that could be spent on higher-value work. Manual report preparation, week after week and month after month, is draining. By the time you’ve pulled data from multiple sources and made it presentable, it’s already outdated.
If financial reporting nightmares are keeping you up at night, you’re not alone. As the long hours exporting data, running reports, and fixing errors cast dark shadows over your days, take heart and get clear insights into your data with these tips. With tools and processes that save you time, you can mark yourself safe from these scary financial reporting situations.
It’s 2 AM after the export workflow failed again. Your users are still waiting for their invoices because your team is in the office manually reformatting 500 of them. By morning, their compliance officer is busy calling when the system times out trying to generate a 100-page report. And before you’ve even had coffee, your biggest customer questions data accuracy because last month’s statement looks nothing like this month’s. The cost?
If you are looking for a reporting solution that can handle complex data and deliver fast results, you might want to check out Jet Reports from insightsoftware. Jet Reports is a powerful Excel-based reporting tool that directly connects to your Microsoft Dynamics ERP and allows you to create custom reports and dashboards with ease using real-time data. Jet Reports is designed to make your reporting experience fast and smooth.