Product Tour - Cloud-based editions of Qlik Sense - Part 2
Part 2 shows you: Adding a thumbnail and making a sheet public, Spaces, Favorites and Collections, and Finding Apps.

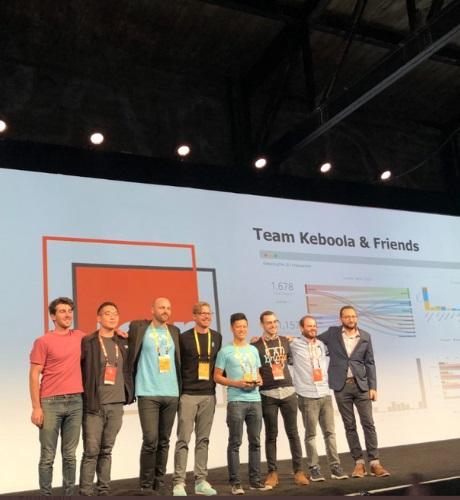
Our team spent the first week of November in San Francisco sponsoring Looker’s annual JOIN conference. We met hundreds of companies who came to talk to us about automated data operations and what benefits they would bring to their organizations.
Back in my college years, I used to listen a lot to the English rock band The Sisters of Mercy. One of my favourite songs is called “More” from the album “Vision Thing.” Singer-songwriter Andrew Eldritch wrote the track around love, lust and broken relationships; his brooding tones repeatedly hammers out the demanding line “I want more” – a line which rings true today for our never-ending lust for data.
Welcome back to DataOps central! My colleagues and I have been blogging and podcasting about the many critical facets of DataOps, which has the power to automate processes to get the right data to the right place at the right time. We’ve examined everything from the key components of the DataOps methodology to the data science behind it all. But one area we haven’t touched on yet is the culture component. You may be asking what do DataOps and culture have to do with one another.
Seek, who is one of our customers, came to us with a laundry list of functionality that their developers wanted. Like many enterprises, they have their own developers who are asked to deliver a design for their UX team and they need and environment where they can do that. They didn’t want us to worry about the UI, they just wanted the ability to code what they wanted directly into the Yellowfin dashboard environment, so we created Yellowfin 9 Code Mode which is our developer platform.
For this post, I’ll once again show you a chart that you may or may not be familiar with, as it’s not one of the most common. But, if you know how to use it, you may consider removing all the gauge charts you have in your dashboard. Therefore, let’s talk about the bullet chart.