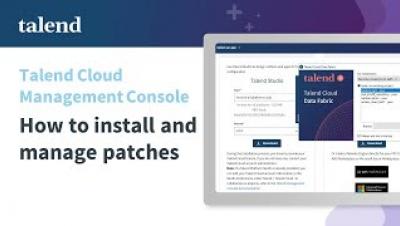
What is the Best ETL Method for Data Analysis?

The five critical elements of ETL methods for analyzing data: ETL is a critical process necessary to discover the nuggets of truth locked inside a business’s vast ocean of data. Different data points, once analyzed as a whole, help businesses make smarter, more informed decisions. Companies that create substantial data figures, all coming from different, separate sources, find that ETL impacts the business’s decisions considerably. But what is ETL?

Monitoring in Edge Flow Manager | Observability with Grafana

This video explains Edge Flow Manager (EFM) integration with Prometheus and Grafana. After installing and configuring Prometheus to scrape, EFM should also be configured to expose metrics. When the time series are in place, Grafana is also installed and configured to visualize exposed metrics. There are some EFM specific Grafana dashboards that are publicly available that can be easily downloaded and imported to Grafana. When everything is configured correctly agent specific dashboards can be accessed from the EFM UI.

Performing Analytics on Call Center Data

Ask any executive if they know what’s going on in their call center, and they’ll assure you they are in control and they know what’s going on. (Executives are always in control and always know what is going on, or so they say.) Then ask the executive what’s actually taking place in the call center, and the executive will say, "We get 10,000 calls each day, and the calls last for 4 ½ minutes." Press the executive a little more: "What are your customers actually saying?

How to Choose the Best Data Visualization for Your Reporting

Data visualization involves visually imparting information to communicate complex data. Graphics such as charts help simplify data so more people can understand the insights embedded within a dashboard or report. Businesses use data visualizations to find and highlight patterns and trends in big data sets, with many data visualization examples available today, including graphs, maps and plots to help others grasp data conveniently.

Sustainability Reporting: A Modern Finance Imperative

ESG reporting is rapidly becoming a key focus area for finance teams around the world. ESG stands for “environmental, social, and governance.” It’s a set of standards through which companies can report metrics that indicate how well their activities align with issues of environmental stewardship and social issues. In late 2021, the International Accounting Standards Board (IASB) announced the creation of a new ESG reporting standard.