Unlocking Retail Location Data with CARTO and BigQuery
Retail companies can easily visualize and analyze their geospatial data in BigQuery using the CARTO platform.


Retail companies can easily visualize and analyze their geospatial data in BigQuery using the CARTO platform.
Unify data from diverse sources and formats using Aiven Kafka's open source streaming. Analyze with BigQuery for swift, accurate insights.
Elements of the Google Data Cloud including BigQuery, DataFlow, and Vertex AI are behind Glean’s personalized enterprise search platform.
Recently, we announced enhanced multi-function analytics support in Cloudera Data Platform (CDP) with Apache Iceberg. Iceberg is a high-performance open table format for huge analytic data sets. It allows multiple data processing engines, such as Flink, NiFi, Spark, Hive, and Impala to access and analyze data in simple, familiar SQL tables.
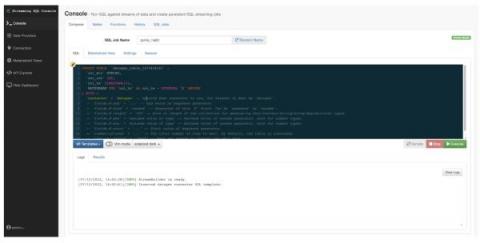
To get the most out of any application, a graphical user interface improves your efficiency and data streaming without exception. A UI should help you through the steps of an often-complex flow as the visible layer between your problem and solution. Even the most hardcore back end enthusiasts will admit that its significance is undeniable for a complete product. It has to be well organized and easy to understand, yet be able to provide the right tools in the right place.
We recognize that extracting the most return from your data isn’t always easy. In fact, for many organizations, it rarely is. According to a recent survey, 97% of respondents said they face challenges using data effectively. And NewVantage Partners found that only 24% of executives say their organizations are data-driven. There are simply too many data sources, too much data volume, and too few resources for these organizations to effectively manage the growing demand for trusted data.