
Over the past several weeks, the term DataOps has reverberated throughout the walls of Hitachi Vantara offices around the world and soon it will take the spotlight at NEXT 2019, the world’s first smart conference. We’ve defined DataOps and how its changing the game by putting the right data into the hands of teams, when and where they need it most. We’ve also talked about Hitachi Vantara’s DataOps journey, Project Champagne.
In this blog post I’m going to write about a famous piece in visualization history. How can we prove that a visualization is more worth than just looking at the data? That’s a question Francis Anscombe probably asked himself when he back in 1973 constructed the dataset that became known as Anscombe's quartet. A dataset he could use to show statisticians how wrong they were thinking that “numerical calculations are exact, but graphs are rough."
We've received a lot of fantastic feedback from industry analysts about Yellowfin and where we're going as an organization. There are three in particular that have come out recently and made me really proud of what we’ve achieved.
The answer to creating an inclusive data culture is in your hands. At Yellowfin, we firmly believe that organisations are far more successful when all their people engage with data. And whilst this has always been the goal of organisations on their journey to being “data-led”, the reality is most are still a long way off. For this to happen, all decision makers need access to insights, in a way that they can understand, not just the data analysts.
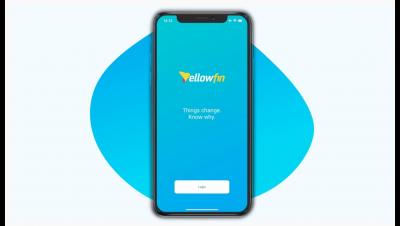
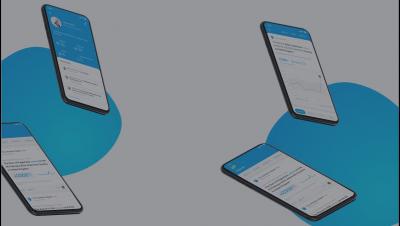
We've got a brand new mobile application coming now out and lots of people have been asking me what’s in it. To be honest, it's much easier to tell you what's not in it - and that’s dashboards and reports. I can hear you saying, ‘How can an analytics vendor have a mobile app with no dashboards or reports?’ But the truth is no one really uses a mobile app to view dashboards or reports. It's the wrong format for looking at a clunky dashboard or detailed report.