Live Mobile App Testing with Real Devices (iOS)
Learn how you can debug faster by live testing your mobile applications on a variety of real iOS mobile devices, using Sauce Labs.


Remote control any device from your browser: Monitor your device inventory: Manage users and devices.
At Stackify, we’re all about helping you improve your application’s performance. We have actually developed two code profilers ourselves. Because of that, we like to think we know a thing or two about code profiling. Today I want to talk about the three different types of code profilers, describe the differences between them, and recommend some tools for your toolbox.
Being a UI developer, I’ve learned one thing: It doesn’t matter how carefully you write your code. Suppose you’ve double-checked that you defined and called all functions the right way or followed all the best practices. Even then you’ll see that a tiny variable can sneak behind and create an error. Now, suppose you find out that for some unknown reason a form validation or submit button isn’t working.
This blog post will explain how to effectively profile your website so that you can deal with performance pain points. We’ll go through the two most used tools in Google Chrome for profiling: Imagine that you optimized your backend and everything is running smoothly. However, for some reason, the load time of your pages is still unreasonably high. Your users might be experiencing sluggish UI and long load times. This post will help you sort these issues out.
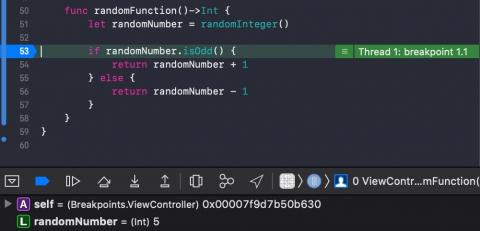
To kick off our series on debugging for software developers, we tell you how to build breakpoints to isolate key information about your app’s performance, and save crucial time during the process.