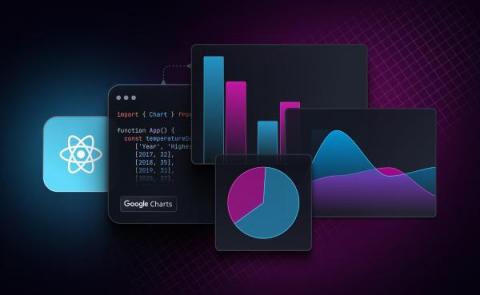
According to research from Matillon and IDG, data volumes increase by 63 percent per month on average in an organization. Examining such substantial volumes of data without the right tools makes it impossible to make informed decisions, even in small businesses. The key to deriving useful and profit-driving insights from data is data visualization - which turns complex raw figures into meaningful visual representations of the data. Google Charts is a free data visualization library provided by Google.
In the world of software-as-a-service, product-led growth (PLG) is an easy way to enable users to experience the value of a product firsthand, without restrictions. PLG can drive adoption, retention, and sustainable business growth with its robust and open framework. But what drives PLG best, a freemium model or a free trial? With freemium, your top of funnel growth can skyrocket, while free trials see a 2-3x higher conversion rate thanks to urgency (ie, users lose access immediately on trial end).
You know measuring in the world of the internet isn’t as easy as taking out a ruler, if you’ve ever tried to develop some simple graphics or designed a web page or an app. It might be challenging to determine the exact location of a design or the bounds of an image when switching between apps with various tools and standards.
Near real-time notifications have become a regular feature in modern applications. These notifications inform us about taxi arrivals, food deliveries, prescription availability, etc. Incorporating this experience into modern enterprise applications is crucial to offer users a smooth, simple, and secure experience.