New Integration: Visualize Your Online Store Performance with WooCommerce
Track and visualize all of your online store KPIs like sales, orders placed, best-selling products (and more!) with Databox.


Track and visualize all of your online store KPIs like sales, orders placed, best-selling products (and more!) with Databox.
Last year, Yellowfin changed the world of business intelligence and analytics with the introduction of Yellowfin Signals. We automated data analysis, removed dashboard dependency, and sped up the process where you would get alerted to the most important changes in your business data, just ask AeroEdge.
In Yellowfin 8 we introduced two new products, Yellowfin Signals, to automatically discover the most critical changes in your business as they happen, and Yellowfin Stories, to provide context to the numbers and tell compelling stories with your data. We’ve received great feedback since then and implemented some of the requested enhancements to improve the user experience, increase governance and performance.
In addition to tracking your email marketing & automation KPIs from Klaviyo, you can also pull data from all of the tools that Klaviyo integrates with right into Databox, too.
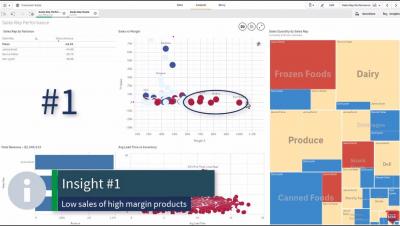
A few years ago, Qlik ran a campaign called the Whole Story. The related video is still posted (fun fact: It was filmed in Qlik’s office near San Francisco). Our message was that you don’t know the whole story in your data if you a.) aren’t able to look at all the data while b.) understanding all the relationships between data.
You shouldn’t have to click ‘back’ in order to navigate to your Databoards. Now, you can view and switch to other Databoards in your account without interrupting your workflow.
Established in Florida in 1994, today, in 2018, the company has more than 1,135 outlets, in 44 US states, Puerto Rico and Canada.