The difference between consuming data and actioning it often comes down to one thing: effective data visualization. Case in point? The John Snow’s famous cholera map. In 1854, John Snow (no, not that one) mapped cholera cases during an outbreak in London. Snow’s simple map uncovered a brand new pattern in the data—the cases all clustered around a shared water pump.
Every financial professional understands that the numbers matter a great deal when it comes to reporting financial results. Accuracy, consistency, and timeliness are important. Those same professionals also know that there’s substantive meaning behind those numbers and that it’s important to tell the stories that lend additional depth and context to the raw financial statements.
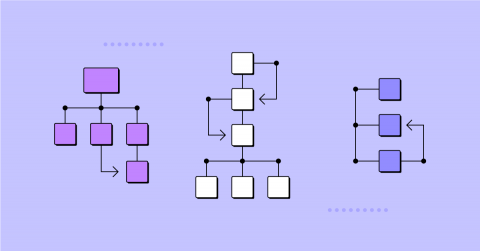
Data modeling is the process of organizing your data into a structure, to make it more accessible and useful. Essentially, you’re deciding how the data will move in and out of your database, and mapping the data so that it remains clean and consistent. ThoughtSpot can take advantage of many kinds of data models, as well as modeling languages. Since you know your data best, it’s usually a good idea to spend some time customizing the modeling settings.
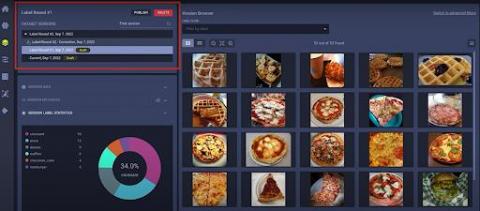
In this blog post, we’ll be taking a closer look at Hyper-Datasets, which are essentially a supercharged version of Clear-ML Data.
In many organizations, transfer pricing adjustments are like a lot of other last-minute activities. They seem to be ignored throughout most of the annual cycle. Then, they suddenly take on a great importance at year-end. That leaves the tax team scrambling to address an entire year’s worth of transactions. It also leads to interdepartmental friction in many cases. If transfer pricing is changed retroactively for the entire year, that can have far-reaching implications.