Systems | Development | Analytics | API | Testing

Benchmark Your Metrics in Databox!

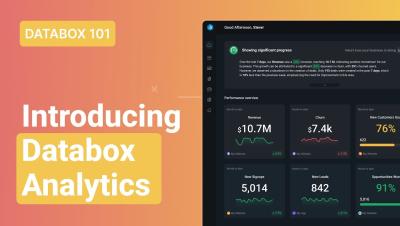
🥁 BIG NEWS: Benchmarks now available in the Databox app! Curious about how your results measure up against companies like yours? Using Benchmarks, you will be able to compare your performance to similar companies, identifying where you are ahead and where you fall behind. Now you can benchmark any metric and empower your data-driven insight right in our Databox Analytics app.

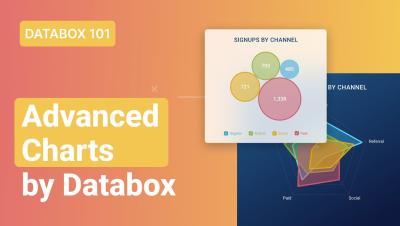
New Era of Data Visualization | Advanced Charts | Databox 101

Welcome to the New Era of Data Visualization - Advanced Charts from Databox are here! From sales figures to customer engagement metrics, data plays an important role in helping your business grow. But here’s the catch: without the right visualization, uncovering actionable insights can be a challenge. With our new and improved data visualizations and the updated Dashboard Designer this will now be easier than ever!

Visualize Your Spreadsheet Data with Databox!

How to visualize your spreadsheet data with Databox? From numbers in a spreadsheet to visual metrics and spreadsheets in minutes, thanks to the Metric Builder function, that lets you integrate your spreadsheets with Databox. And if your data in structured in a non-conventional way (data in rows instead of in columns, data on different sheets, or when row numbers don't line up) we have the Manual Setup, allowing you to easily select the right cells to visualize your data - without using any code at all!

New in Databox: Build and Automate Custom Reports in Minutes

Here at Databox, we believe that data is about more than just numbers. We want to bring our users even more ways to share meaningful insights. Most of all, we want to help growing teams and agencies take reporting to a new level through the power of automation. Say hello to Databox Reports. This brand new feature allows teams and agencies alike to build and automate Reports right inside Databox.