Systems | Development | Analytics | API | Testing

Cost-Per-Order Formula for E-Commerce Explained

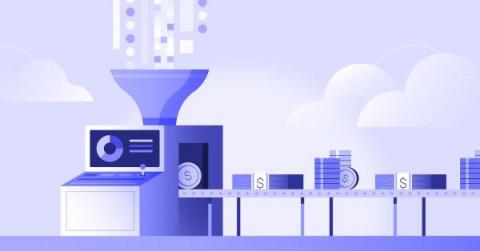
Our Five Key Points: You have a customer. They want a product: you sell that product. It’s simple, but how do you know if you’re charging the right amount for that product? Knowing how to calculate the cost per order is essential in helping you set the correct prices for your products and services. As an e-commerce retailer, you’ll naturally have lower overheads than a brick-and-mortar store.

Space-Based AI Shows the Promise of Big Data

At a distance of a million miles from Earth, the James Webb Space Telescope is pushing the edge of data transfer capabilities. The observatory launched Dec. 25 2021 on a mission to look at the early universe, at exoplanets, and at other objects of celestial interest. But first it must pass a rigorous, months-long commissioning period to make sure that the data will get back to Earth properly. Mission managers provided an update Feb.

SQL Puzzle Optimization: The UDTF Approach For A Decay Function

How do you implement a decay function in SQL? You can use window functions, which scale better than joins, or better yet, you can try what Felipe Hoffa did: use tabular UDFs. In this video, Felipe shows you how you can use a tabular UDF to write custom code that can analyze a table row by row while preserving state. Felipe wrote a table UDF in JavaScript that uses a low amount of memory to keep track of the decaying values. He was able to run it in 36 seconds, instead of the 46 seconds that the SQL with windows solution took; and then he optimized the JavaScript even further and ran it in just 9 seconds.

Google Cloud names ThoughtSpot a Google Cloud Ready - BigQuery company to help customers dominate the decade of data

We’re entering the defining decade of data. While every aspect of our lives have been changed by data in recent years, the next ten will see data rebuild the world around us. Every business, in every industry, needs a plan to adapt to this new world if they want to thrive. But how? That’s a question in the minds of data leaders, CEOs, and board members. The right approach is critical if companies want to dominate this new era. The wrong decision can spell disaster.

Building Product Analytics At Petabyte Scale

Product analytics is the most critical and complex task for any product team. There are thousands of data points that have to be analyzed carefully while setting up the product analytics foundation and it enables product teams to use data to track, visualize, and analyze user engagement and behavior that can be used to improve and optimize a product experience. However, managing large data workloads can be very challenging as not all data that is collected can be directly used for analytics.

AstraZeneca: Building a finance data hub

At AstraZeneca, supporting funcstions like Finance are intensely data-driven. Recently, the data and IT team completely overhauled their data architecture to better serve the needs of the Finance team, they decided to build a Finance data hub. In this video, key project stakeholders explain why and how they build the data hub for the finance team (using Talend and AWS), and they detail how it's integrated with other data hubs at astraZeneca.

Data-Centric AI with Continual and Snowflake

Data infrastructure is rapidly growing and evolving along with infrastructure for AI/ML, with the latter growing largely independent from the former. An emerging generation of AI/ML tooling emphasizes data-centric versus model-centric approaches to the ML development lifecycle. These tools recognize that data is the foundation for AI and seek to open opportunities for all data professionals to participate by eliminating the unnecessary complexity of traditional model-centric solutions.

Cortex leverages ThoughtSpot Everywhere to innovate in B2B marketing intelligence

Gaining an accurate view of revenue intelligence for B2B markers is challenging. With disconnected and dirty data residing in many systems, customers need a solution that collects, normalizes, and aggregates information into reports that answer the questions B2B marketers should have a handle on. And let’s face it, no matter how great a set of standard reports might be, every customer wants to see their data a little differently.