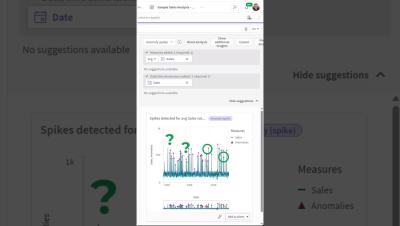
#shorts - Think you're catching all the spikes in your #data? Think again.

With Qlik’s Anomaly (Spike) analysis type, you don’t just see the obvious — you uncover the hidden outliers buried deep in your data. Just pick your measure and time field... ...and boom — hashtag#Qlik surfaces the real anomalies in seconds. You also get narrative insights showing biggest spikes. smallest drops and total anomalies. No guesswork. Just instant, actionable insight. Let Qlik do the heavy lifting — so you can move faster, smarter.


Beyond the Hype: Putting Enterprise AI To Work

In this episode, Dana Gardner, Principal Analyst at Interarbor Solutions, is joined by Sridhar Ramaswamy, CEO of Snowflake. They discuss the impactful integration of AI with enterprise data, Snowflake's efforts to demystify AI for its customers, and future prospects for agentic AI and its potential to transform business processes.

The Fascinating History of Data Visualization: From Basic Maps to BI

Data visualization is an elementary component of human learning and understanding. It's also a significant capability of business intelligence (BI) and analytics solutions today. So, how did data visualization first come to be? The humble origins and gradual evolution of data visualization tools has led to an interesting timeline.

Top 40 Engineering KPIs and Metric Examples for 2025 Reporting

An engineering Key Performance Indicator (KPI) or metric is a clearly defined quantifiable measure that an engineering firm uses to gauge its success over time. With engineering being a very broad field, KPIs are employed in a variety of ways, ranging from company-wide analysis to project specific performance metrics. Company wide KPIs can be used to compare companies in the same industry, while project specific KPIs should be used internally to evaluate project performance.

Importance of Column Selection in AI-driven automated insights

Everyone associated with Business Intelligence (BI) applications is talking about their Artificial Intelligence (AI) journey and the integration of AI in analytics. Artificial intelligence encompasses a broad spectrum of categories, including machine learning, natural language processing, computer vision, and automated insights. ThoughtSpot has been a leader in augmented analytics, leveraging AI to automate insights and empower users to make data-driven decisions.

How Countly Supercharges AI: A Game-Changer for Data-Driven Innovation

If you’re building AI systems—whether for personalization, fraud detection, or predictive analytics—you already know the brutal truth: your models are only as good as the data you feed them. Enter Countly, an analytics platform that doesn’t just collect user data but transforms it into rocket fuel for AI. This isn’t about explaining what Countly does (AI can do that for you).